ملف:Sahel rainfall timeseries de.svg

حجم معاينة PNG لذلك الملف ذي الامتداد SVG: 800 × 333 بكسل. البعد الآخر: 2٬560 × 1٬067 بكسل.
الملف الأصلي (ملف SVG، أبعاده 1٬200 × 500 بكسل، حجم الملف: 21 كيلوبايت)
وصف قصير
| ⧼wm-license-information-description⧽ |
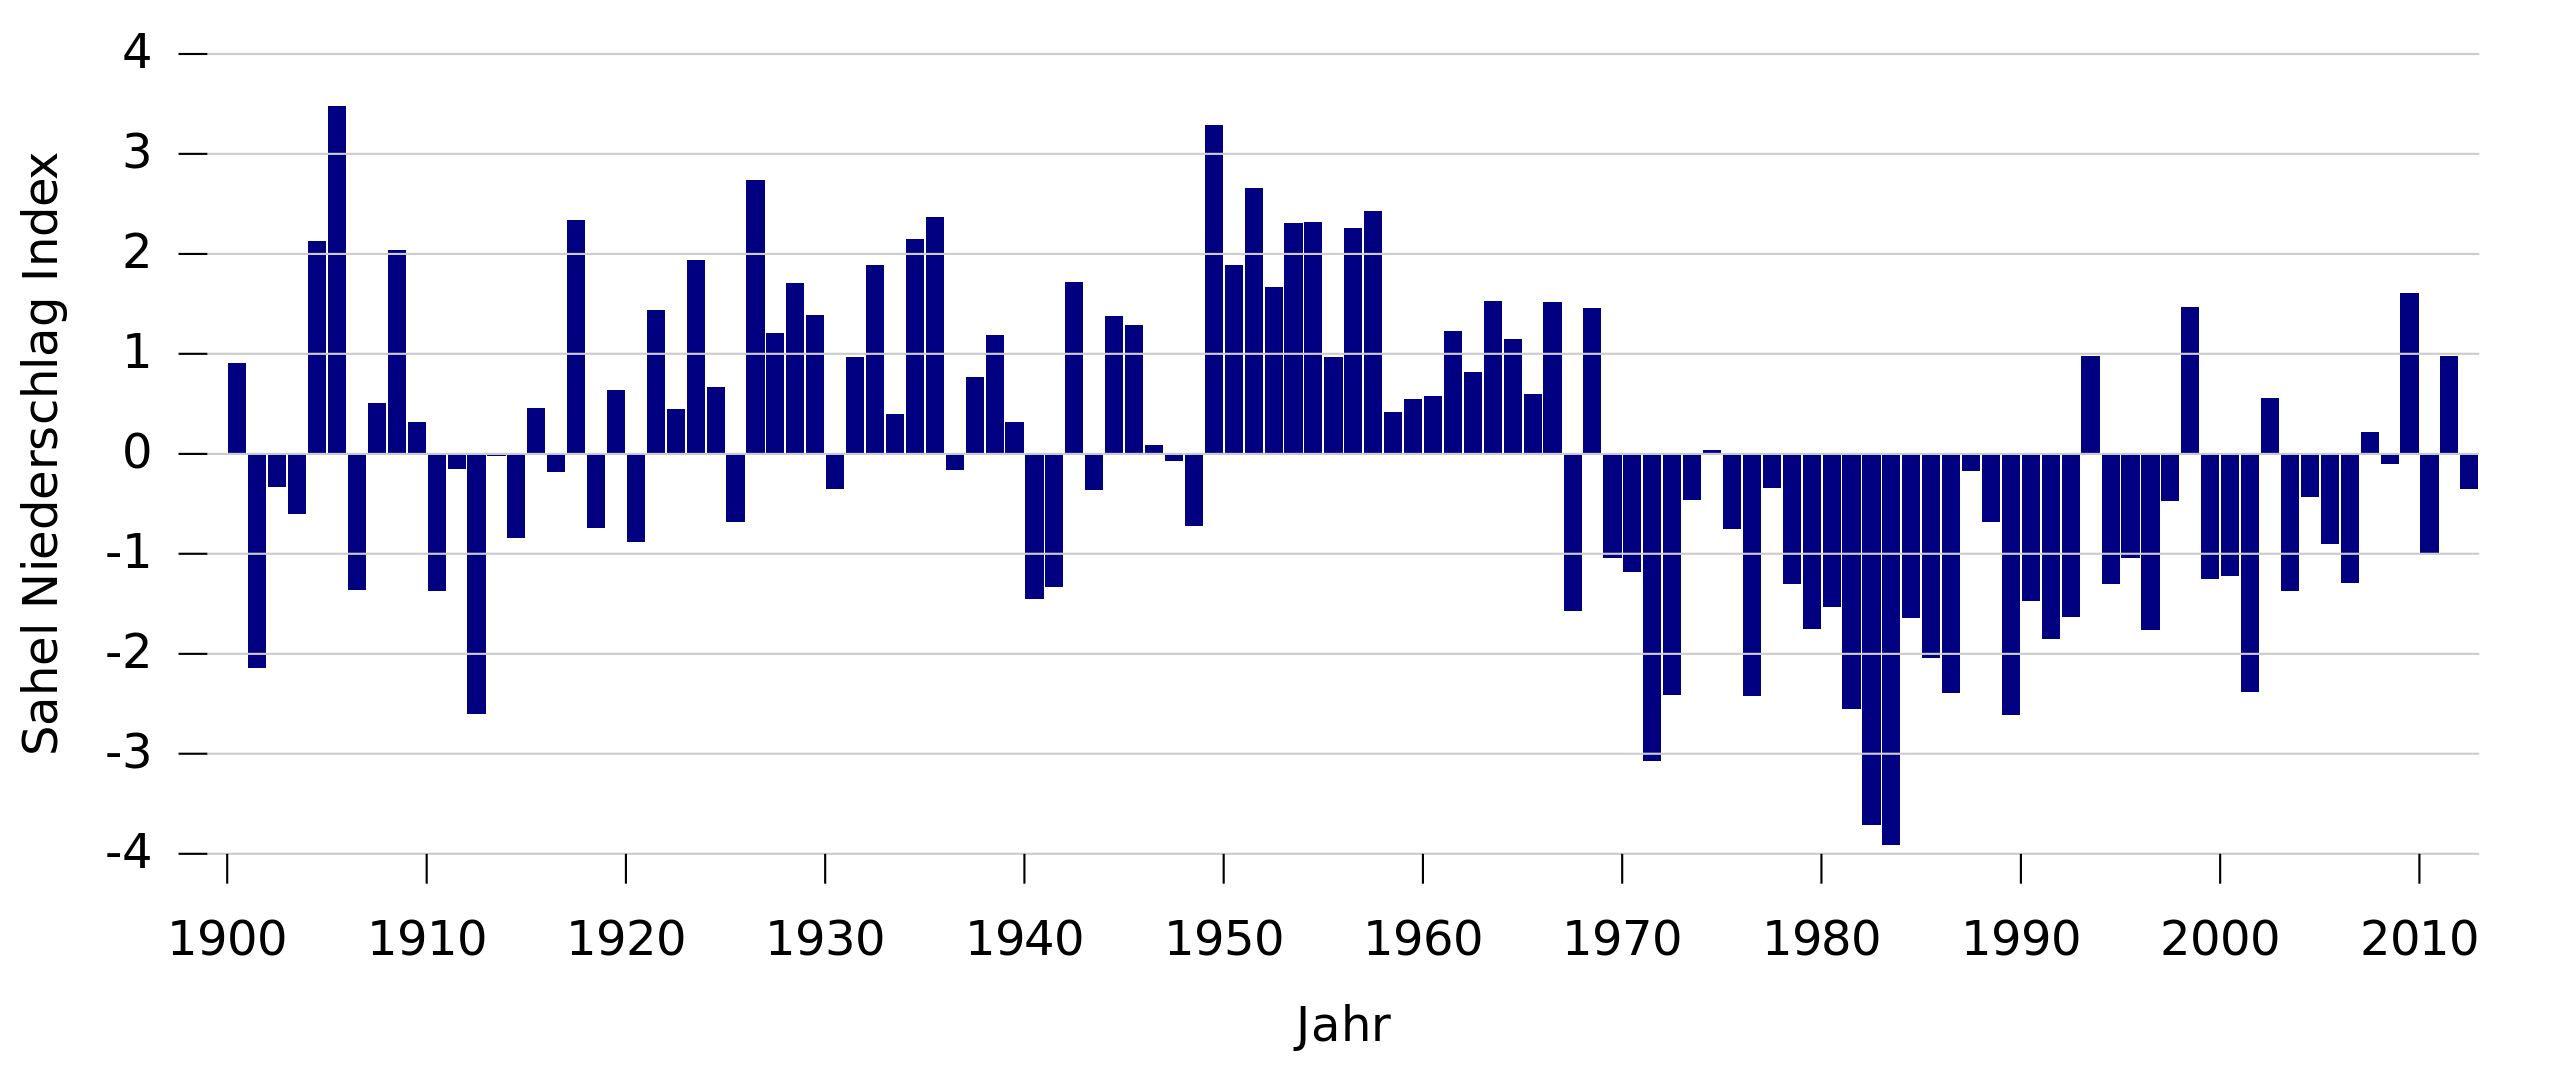
English: More than a century of rainfall data in the Sahel show an unusually wet period from 1950 until 1970 (positive index values), followed by extremely dry years from 1970 to 1990 (negative index values). From 1990 until present rainfall returned to levels slightly below the 1898–1993 average, but year-to-year variability was high.
Deutsch: Abweichung der Sahelzonen-Niederschlagsmenge vom Mittelwert des 20. Jahrhunderts.Der Zeitraum 1950-1970 war ungewöhnlich feucht(positive Werte), der Zeitraum 1970 bis 1990 extrem trocken (negative Werte).
|
| ⧼wm-license-information-date⧽ | 2008 |
| ⧼wm-license-information-source⧽ | Own work, based on JISAO data |
| ⧼wm-license-information-author⧽ | Benedikt.Seidl |
| ⧼wm-license-information-other-versions⧽ |
ترخيص
Quellcode
download the data:
#!/usr/bin/python
# -*- coding: utf-8 -*-

import urllib

def main():
    url = "http://jisao.washington.edu/data_sets/sahel/"
    line_before = "        +0    1    2    3    4    5    6    7    8    9\n"
    data = urllib.urlopen(url)
    for line in data:
        if line == line_before:
            for ten_years in data:
                ten_years = ten_years.strip()
                if ten_years == "":
                    break
                elements = map(int, ten_years.split())
                year_start, rain_data = elements[0], elements[1:]
                for year, rain_data in enumerate(rain_data, year_start):
                    print("{0} {1}").format(year, rain_data)

if __name__ == '__main__':
    main()
gnuplot:
#!/usr/bin/gnuplot

set terminal svg enhanced size 1200 500 fname "DejaVuSans" fsize 18
set output "Sahel_rainfall_timeseries_de.svg"

set noborder
set key reverse right bottom
set nokey
set xtics nomirror out
set ytics nomirror out
set ylabel 'Sahel Niederschlag Index'
set yrange [-4:4]
set xlabel 'Jahr'
set style line 12 lc rgb '#cccccc'
set grid ytics front linestyle 12
set xtics ("1900" 0, "1910" 10, "1920" 20, "1930" 30, "1940" 40, "1950" 50, "1960" 60, "1970" 70, "1980" 80, "1990" 90, "2000" 100, "2010" 110, "2020" 120)

set style data histogram
set style histogram cluster gap 0.2
set style fill solid noborder
set boxwidth 0.9

plot 'rain.data' u ($2/100) ti col lc rgb '#000080'
execute:
python rain.py > rain.data && gnuplot rain.dem
تاريخ الملف
اضغط على زمن/تاريخ لرؤية الملف كما بدا في هذا الزمن.
| زمن/تاريخ | صورة مصغرة | الأبعاد | مستخدم | تعليق | |
|---|---|---|---|---|---|
| حالي | ★ مراجعة معتمدة 00:14، 13 يوليو 2024 | | 1٬200 × 500 (21 كيلوبايت) | Pastakhov (نقاش | مساهمات) | Upload https://upload.wikimedia.org/wikipedia/commons/9/91/Sahel_rainfall_timeseries_de.svg |
لا يمكنك استبدال هذا الملف.
وصلات
لا يوجد صفحات تصل لهذه الصورة.